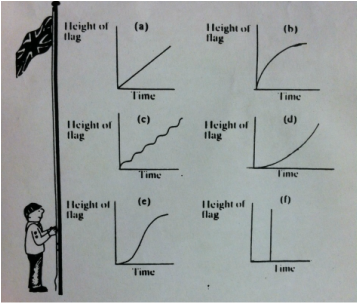
1: Each graph would represent how much time the boy scout takes to raise the flag.
2: Graph C is most realistic because the boy scout could face wind resistance, he could lose grip of the pulley momentarily, or his hands could slide on the pulley. This causes a variation of height as time goes by. But when the flag reaches the top of the pull, the height would stop increasing.
3. Graph F is the most unrealistic because there is no way the boy scout can pull the flag to the top of the pole in one second or one unit of time.
 RSS Feed
